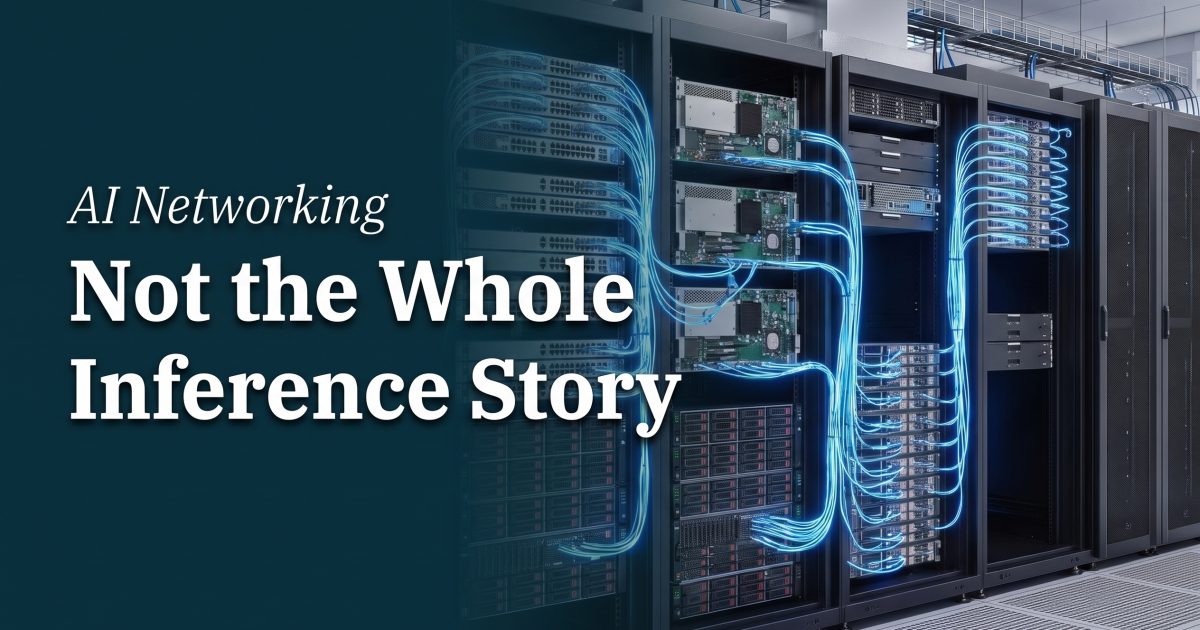
AI networking now shapes inference quality of service as directly as GPU selection. A production agent does not send one prompt to one accelerator and stop. It may retrieve documents, read a cache, call tools, invoke several models, apply policy checks, and write state before returning a result. Each hop uses a network, and a slow or congested hop becomes user-visible latency.
That changes the planning question for developers and infrastructure teams. Tokens per second from one GPU still matters. So do time to first token, p95 end-to-end task time, tail latency during a burst, and how much accelerator time is spent waiting for context or results. A cluster can have unused GPU headroom and still feel slow because the data path has become the constraint.
AI networking is part of the inference pipeline
The useful mental model is a pipeline, not a box around a GPU. A request enters through a load balancer, reaches an inference server, pulls a key-value cache or retrieved context, may call a tool service, and then streams tokens back. In a distributed deployment, tensor-parallel and expert-parallel models add east-west traffic between accelerators. Storage, observability, authentication, and scheduling add more shared services.
Those paths compete for bandwidth, buffers, CPU cycles, and predictable delivery. Congestion is especially expensive for interactive work because a delayed small control message can hold up a much larger compute stage. A fast average does not rescue a poor p95. Users experience the slow request.
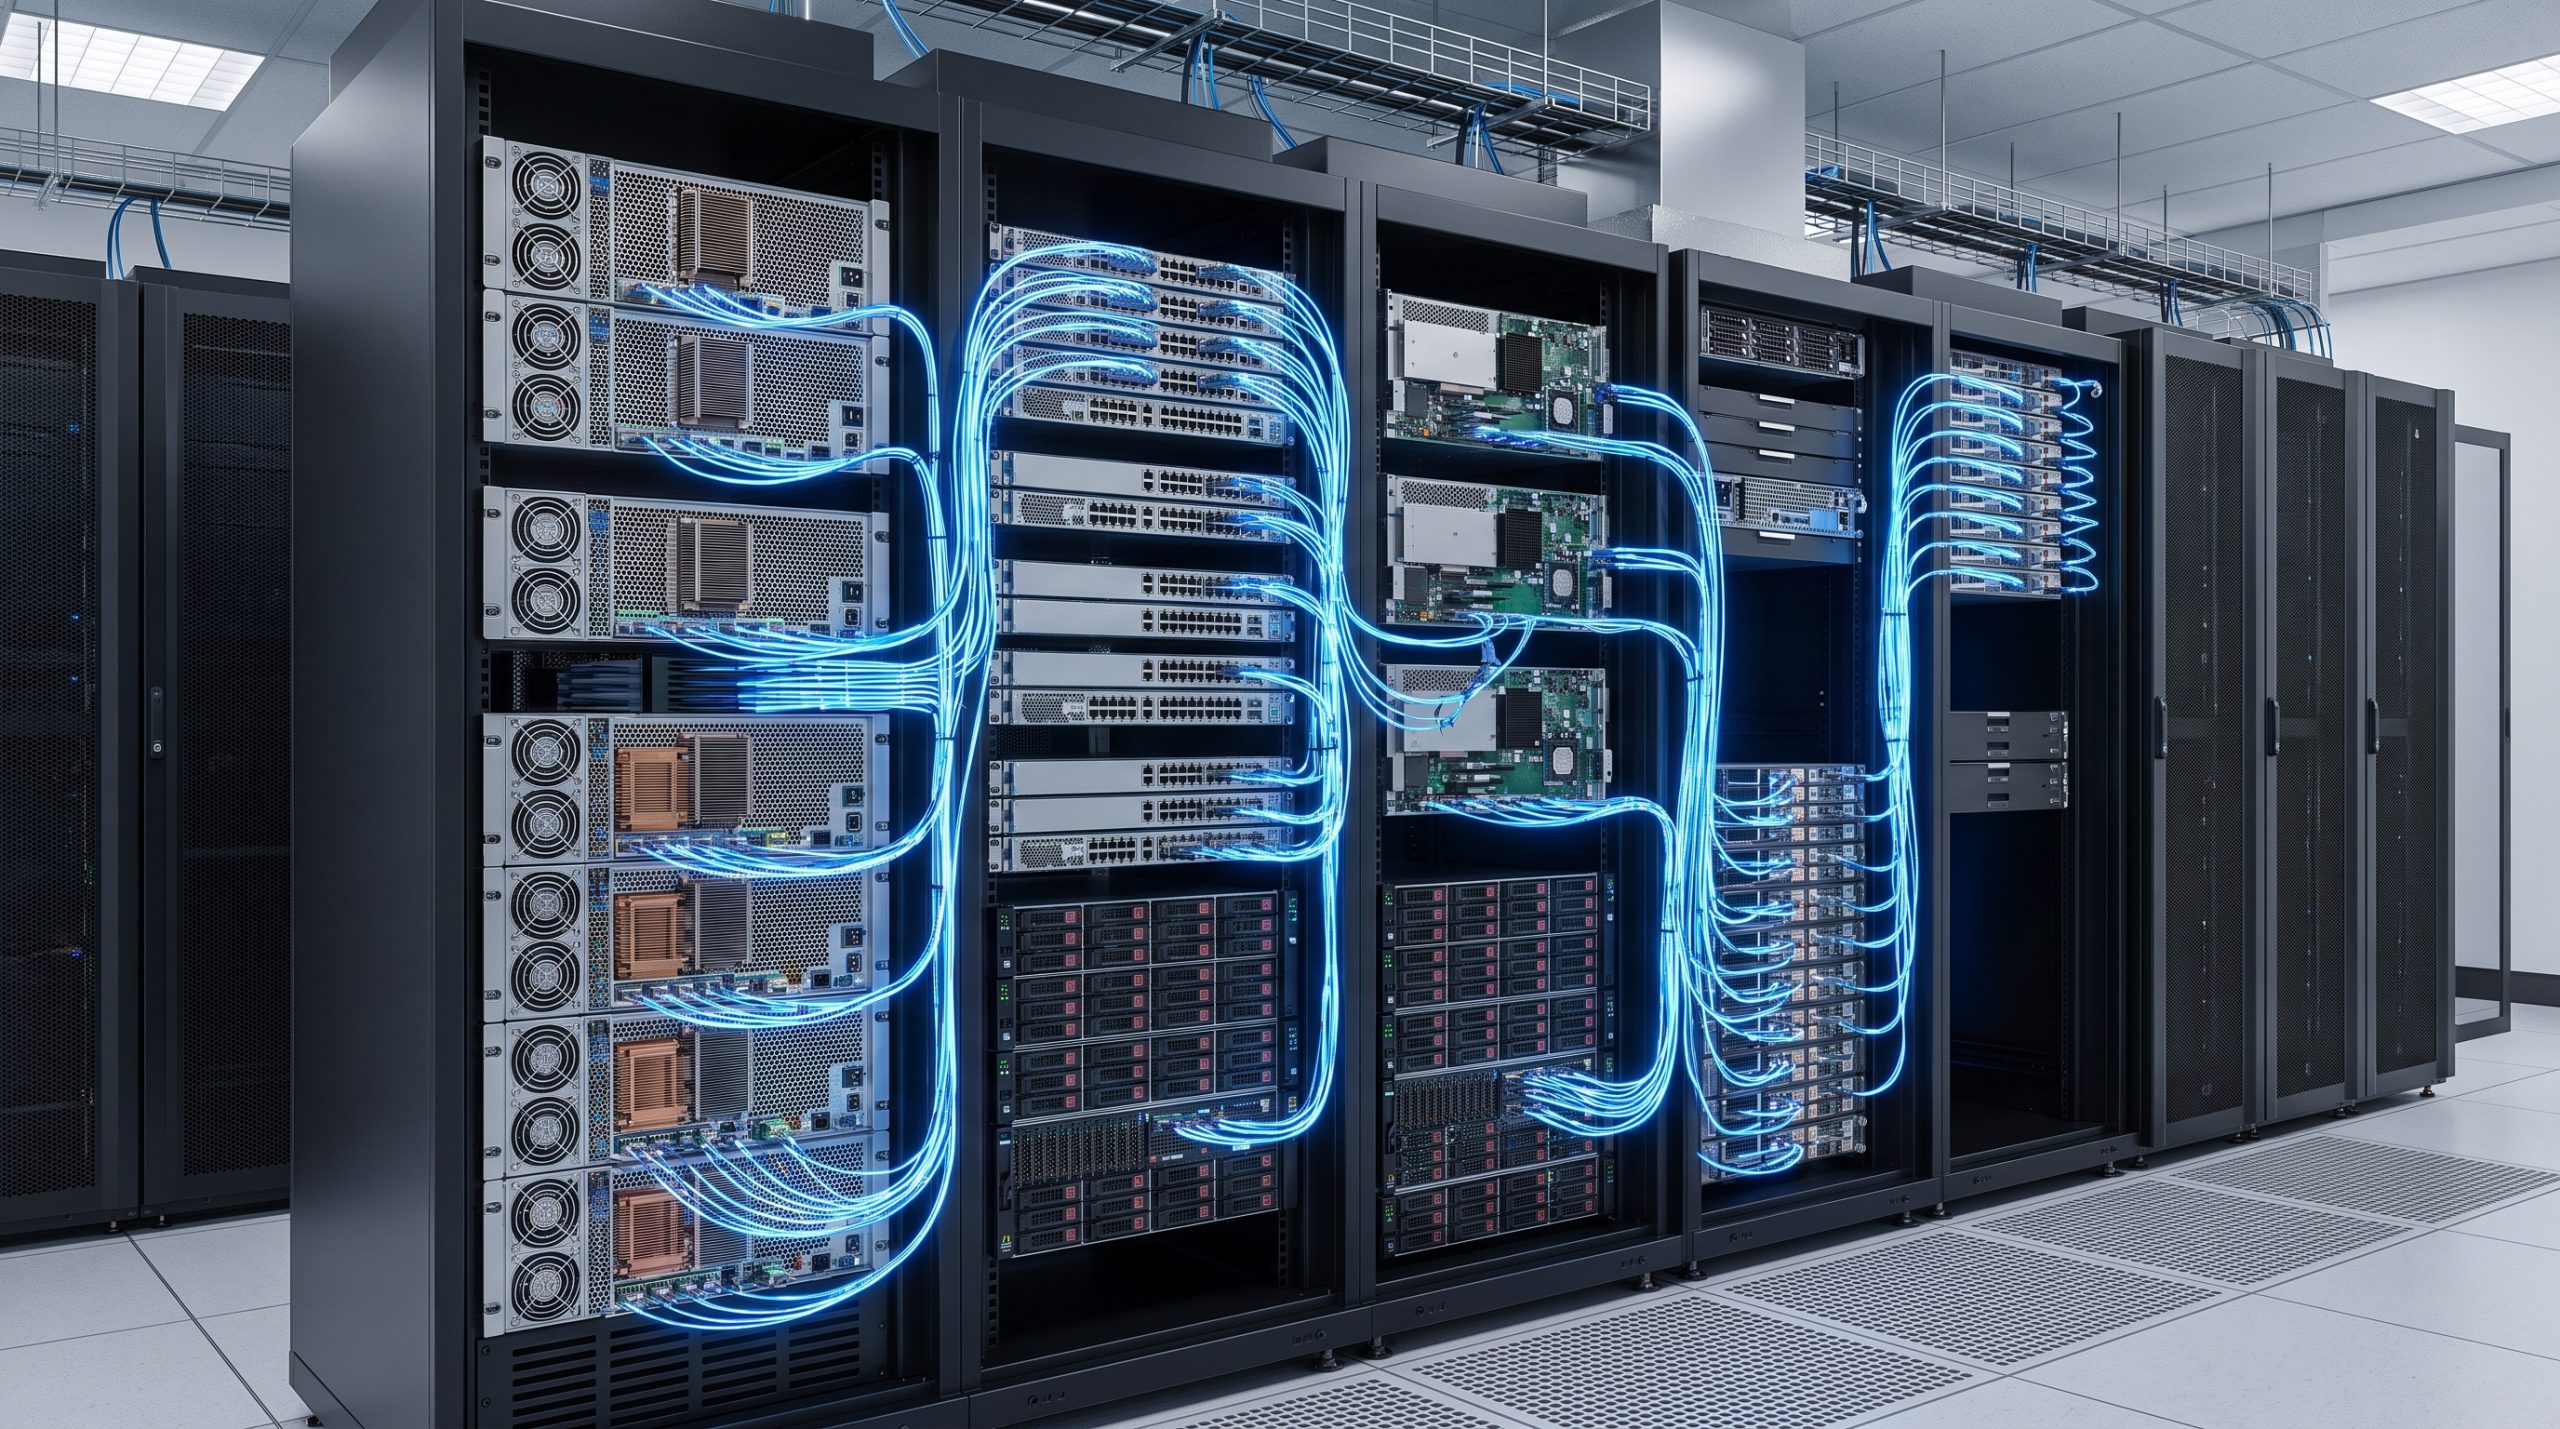
NVIDIA’s July 2026 BlueField technical overview describes agentic inference as a workflow spanning GPUs, CPUs, memory, networking, storage, and security. Its BlueField-4 specification combines up to 800 Gb/s connectivity, a 64-core Grace CPU, LPDDR5X memory, PCIe Gen6, and inline acceleration. The point is not that every cluster needs a DPU. It is that packet processing, storage services, telemetry, and security policy can steal host resources when they share the same critical path as serving.
Why agents expose the problem sooner
A short chat completion can keep most of its work local after the prompt arrives. Agent workloads are more chatty. They fan out to retrieval, tool, memory, and policy services, then carry intermediate state into the next model call. One completed task may include many small requests rather than one large transfer. That pattern makes packet loss, queueing, connection setup, and cache misses more visible.
Mixture-of-experts models add another example. A routing decision can send token activations to experts on other GPUs. The model may have plenty of arithmetic capacity, yet progress waits on collective communication. The same holds for disaggregated prefill and decode: separating phases can improve utilization, but it also makes the handoff between compute pools a service dependency. AI networking needs enough bandwidth, low enough contention, and clear failure behavior for that dependency.
Multi-tenancy raises the stakes. One workload can create microbursts from retrieval or checkpoint traffic while another tries to stream output. Aggregate throughput may look healthy while a small group of users sees erratic first-token latency. Isolation at the network and storage layers is therefore a product feature, not just a compliance checkbox.
The numbers that matter
Start with link speed, then look beyond it. BlueField-4’s 800 Gb/s figure equals 100 GB/s before protocol overhead. That is substantial, but it says nothing by itself about switch oversubscription, congestion control, cable topology, queue depth, or the number of hosts sharing an uplink. A fabric is only as fast as its most contended stage.
NVIDIA’s Spectrum-X page cites up to 95% effective network bandwidth at scales above 100,000 GPUs and a 1.6x AI performance claim versus traditional Ethernet. Those are vendor-reported platform figures, not a substitute for a workload benchmark. Still, they describe the correct target: effective bandwidth under AI traffic, not the port speed printed on a switch.
For an inference service, collect at least these numbers per model and traffic class:
- Time to first token and inter-token latency at p50, p95, and p99.
- End-to-end task completion time, including retrieval and tool calls.
- GPU duty cycle, host CPU consumed by networking and storage work, and queue time before execution.
- NIC throughput, retransmits, ECN marks, packet drops, and queue occupancy.
- Cache hit rate, remote fetch latency, and bytes transferred per completed request.
Pair the measurements. GPU utilization without queueing data can hide starvation. Network throughput without application latency can hide head-of-line blocking. Cost per token improves only when the faster path produces more completed work at the same service target.
How to benchmark the fabric instead of admiring it
Run a baseline with warm caches and steady traffic. Then make it uncomfortable. Repeat the test with cold retrieval, a deliberately slow storage response, a burst of simultaneous tool calls, and one unavailable model endpoint that triggers a reroute. These are normal production events, not edge cases.
Keep prompt length, output length, concurrency, and model placement fixed when comparing network changes. Measure the entire request, not only decode speed. A good test can show whether an upgrade lowers p95 task time, reduces host CPU overhead, or merely moves the bottleneck into storage.
Test the small messages too
Large throughput tests miss a common agent failure mode: tiny control messages delayed behind bulk traffic. Include short tool responses, cache keys, routing events, and token streaming in the load mix. Record jitter as well as averages. A network that delivers high bulk throughput but causes visible stream stalls is not meeting an interactive inference objective.
Practical design choices for infrastructure teams
First, map each request path before buying capacity. Draw where context enters, where key-value state lives, where tools run, and which flows cross racks or availability zones. This often identifies avoidable remote reads before a fabric purchase does.
Second, separate traffic classes where the deployment justifies it. Training checkpoints, bulk data ingestion, storage replication, interactive decode, and control-plane traffic have different latency tolerance. They should not all compete in one unmanaged queue.
Third, treat observability as part of AI networking. Correlate application traces with GPU telemetry, NIC counters, switch telemetry, and storage latency. If the trace cannot identify whether a slow request waited on compute, a cache, a tool, or a network queue, the team cannot fix the right layer.
Finally, size for the percentile that carries the product promise. A demo may survive a brief pause. An API with a latency SLO cannot. The GPU remains central to inference, but it delivers its value only when context and results move through the rest of the system on time. Run and scale models with Wiro.