
AI GPU pricing looks simple when a provider quotes dollars per GPU-hour. That number only tells part of the story. For a production inference service, the useful question is how much it costs to deliver accepted output tokens while meeting a latency target. A $12-per-hour node that produces 800 useful tokens per second costs about $4.17 per million tokens before storage, networking, and operations. A $20-per-hour node that sustains 2,000 tokens per second costs about $2.78 per million. The second node costs more each hour and less for the work the application sells.
Why hourly rates mislead
Hourly price measures reserved capacity. Inference economics measures completed work. The gap matters because an LLM server does not turn GPU seconds into user value at a fixed rate. It alternates between prompt processing, token generation, waiting for requests, batching work, loading cache state, and handling slow tails. A rate card cannot show any of that.
Consider two clusters that both cost $24 per hour. Cluster A produces 1,000 output tokens per second only under a large batch, but falls to 250 tokens per second when traffic is sparse. Cluster B holds 600 tokens per second across the day because its scheduler can batch requests without breaking the p95 latency budget. At 250 tokens per second, Cluster A costs $26.67 per million tokens. Cluster B costs $11.11. A finance report that sees the same hourly bill misses a 2.4x operating difference.
This is why vendor performance claims need context. NVIDIA frames inference around cost per token rather than raw GPU cost, because an inference stack includes compute, CPUs, networking, software, and power. The same idea applies to a smaller deployment: a fast accelerator can lose its advantage if the runtime leaves it idle or a queue policy makes users abandon requests.
AI GPU pricing: calculate the delivered-token cost
The core calculation is straightforward:
cost per million tokens = hourly infrastructure cost / (sustained tokens per second x 3,600 / 1,000,000)
Use sustained throughput, not a peak from a benchmark chart. Include every GPU in the serving group. If a 70B model needs four accelerators because weights, KV cache, and runtime headroom do not fit on one, the hourly numerator is the four-GPU cost. Include the CPU hosts and network surcharge when those are separately billed.
Take a four-GPU group at $3 per GPU-hour, plus $1.20 per hour for host and network costs. The group costs $13.20 per hour. At 1,100 delivered tokens per second, its compute-and-host cost is $3.33 per million tokens. If the same group reaches 1,650 tokens per second after better continuous batching, the cost falls to $2.22 per million. No hardware changed. The serving policy did.
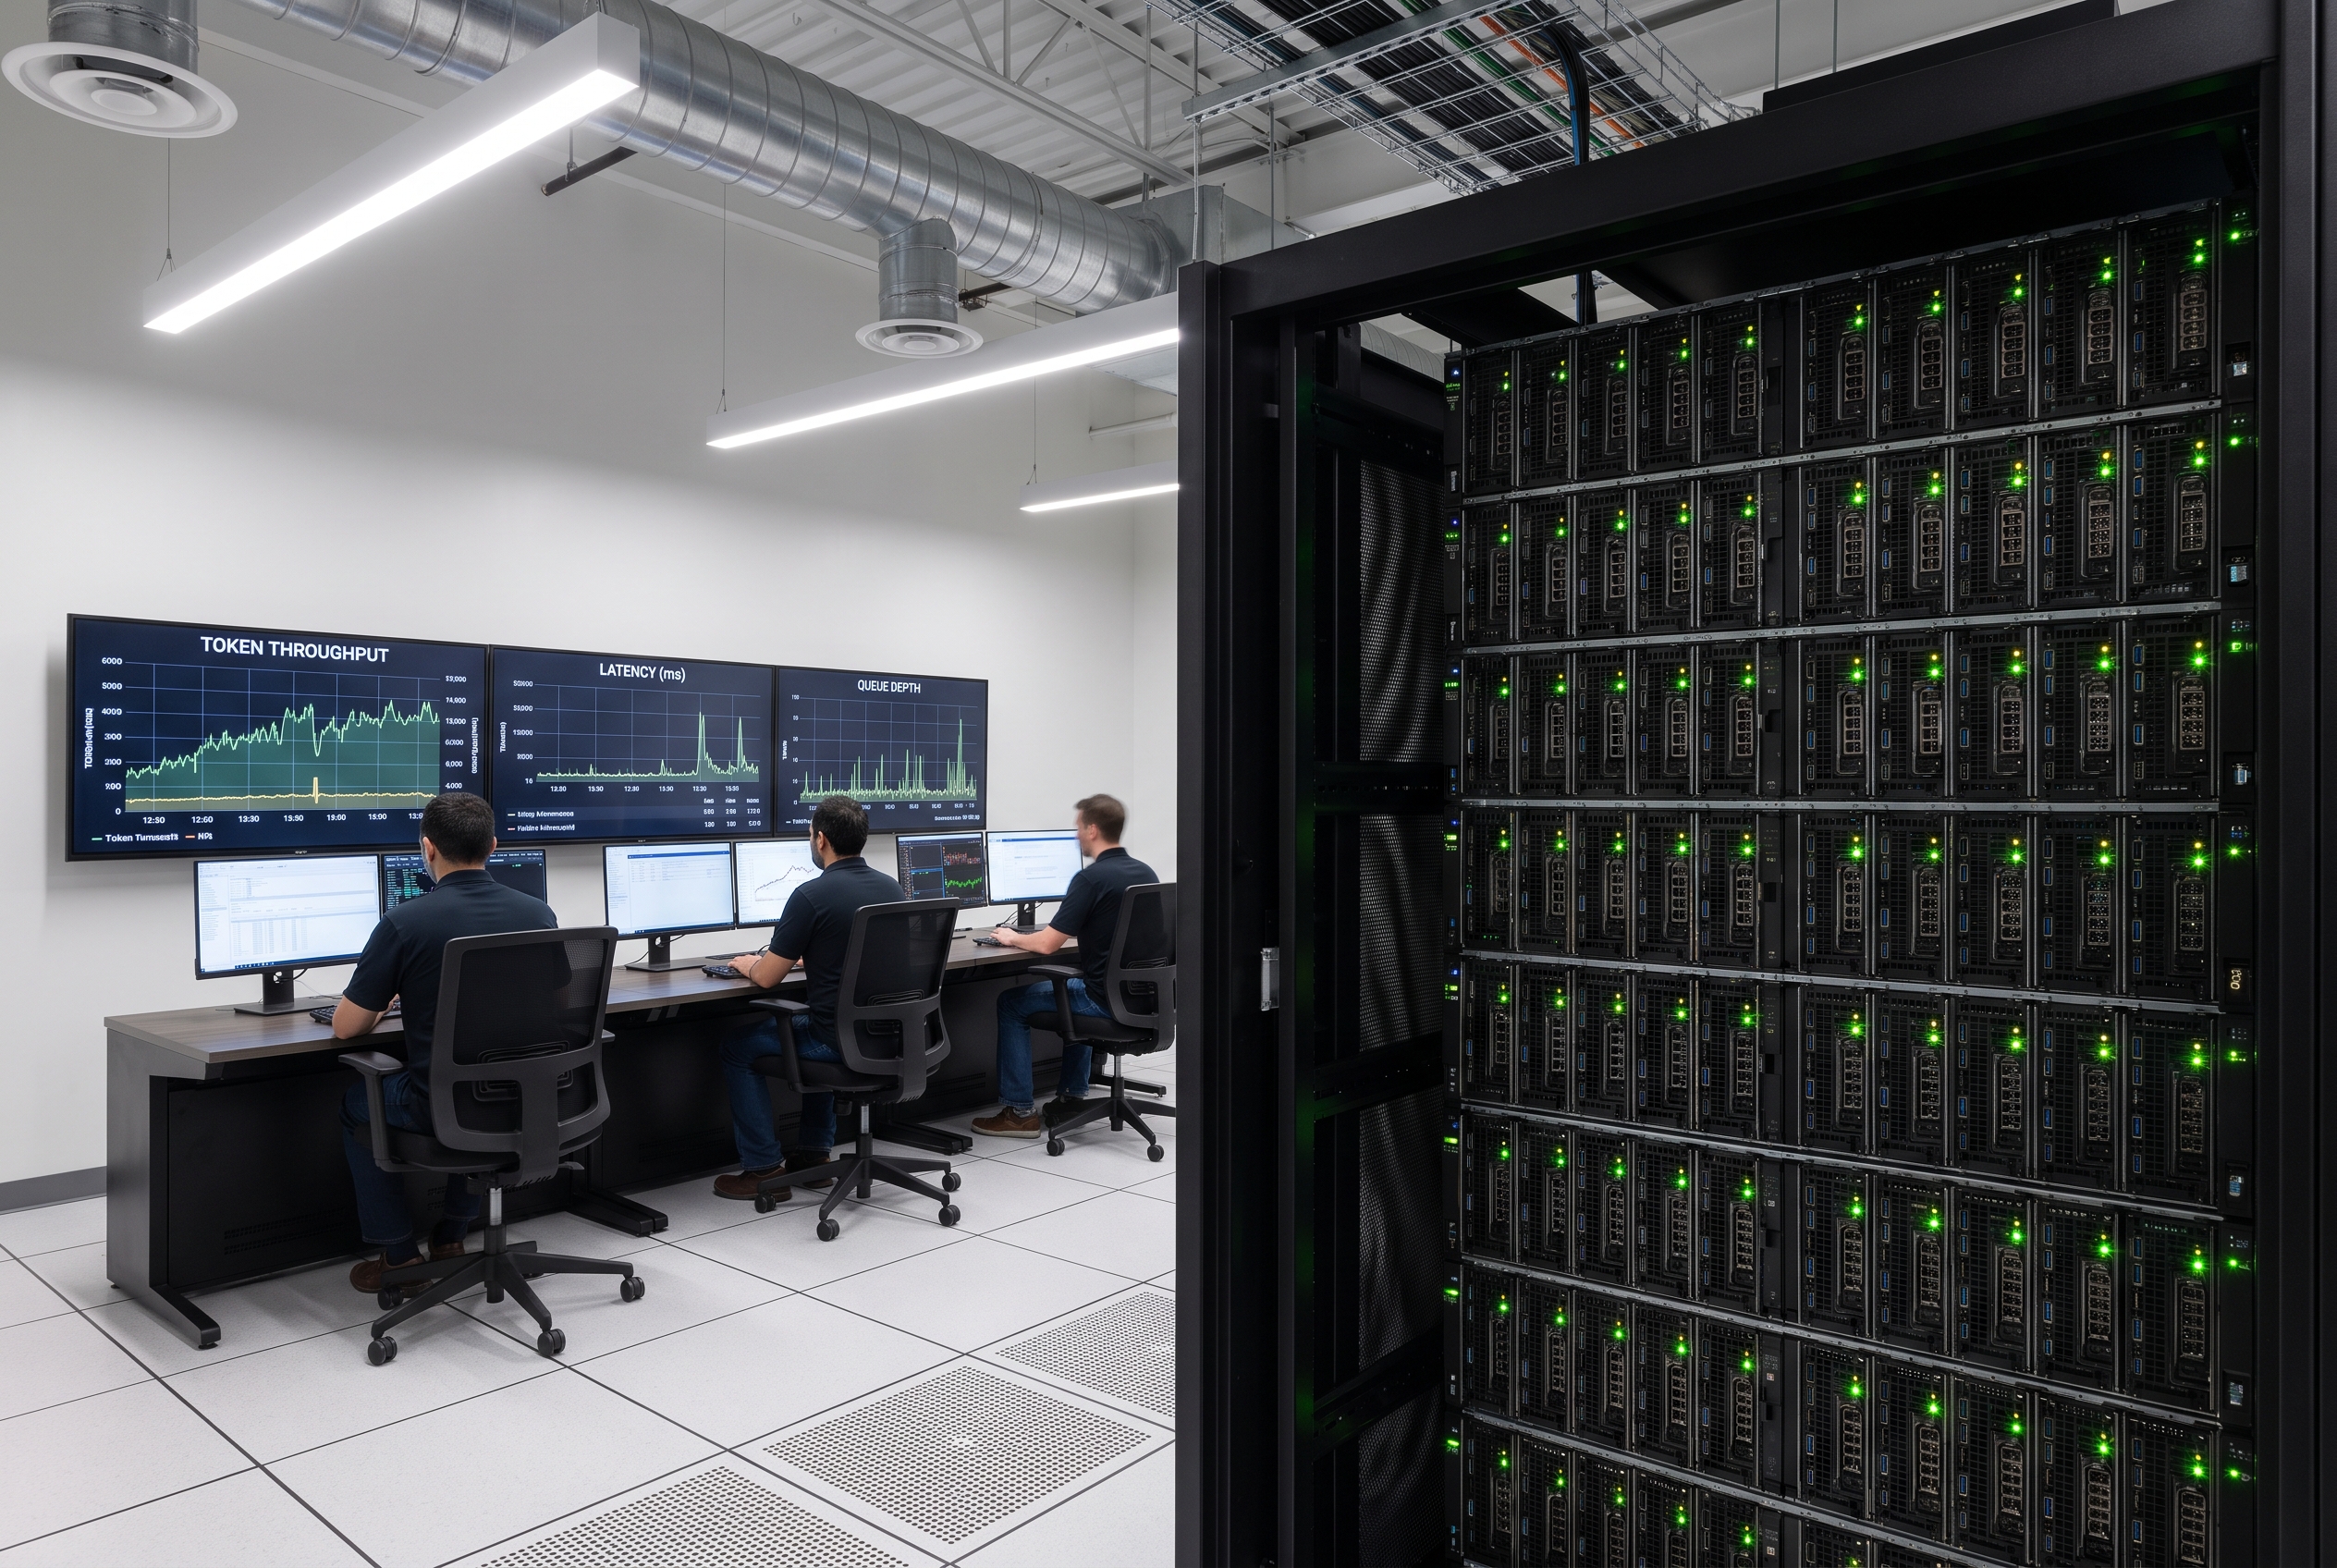
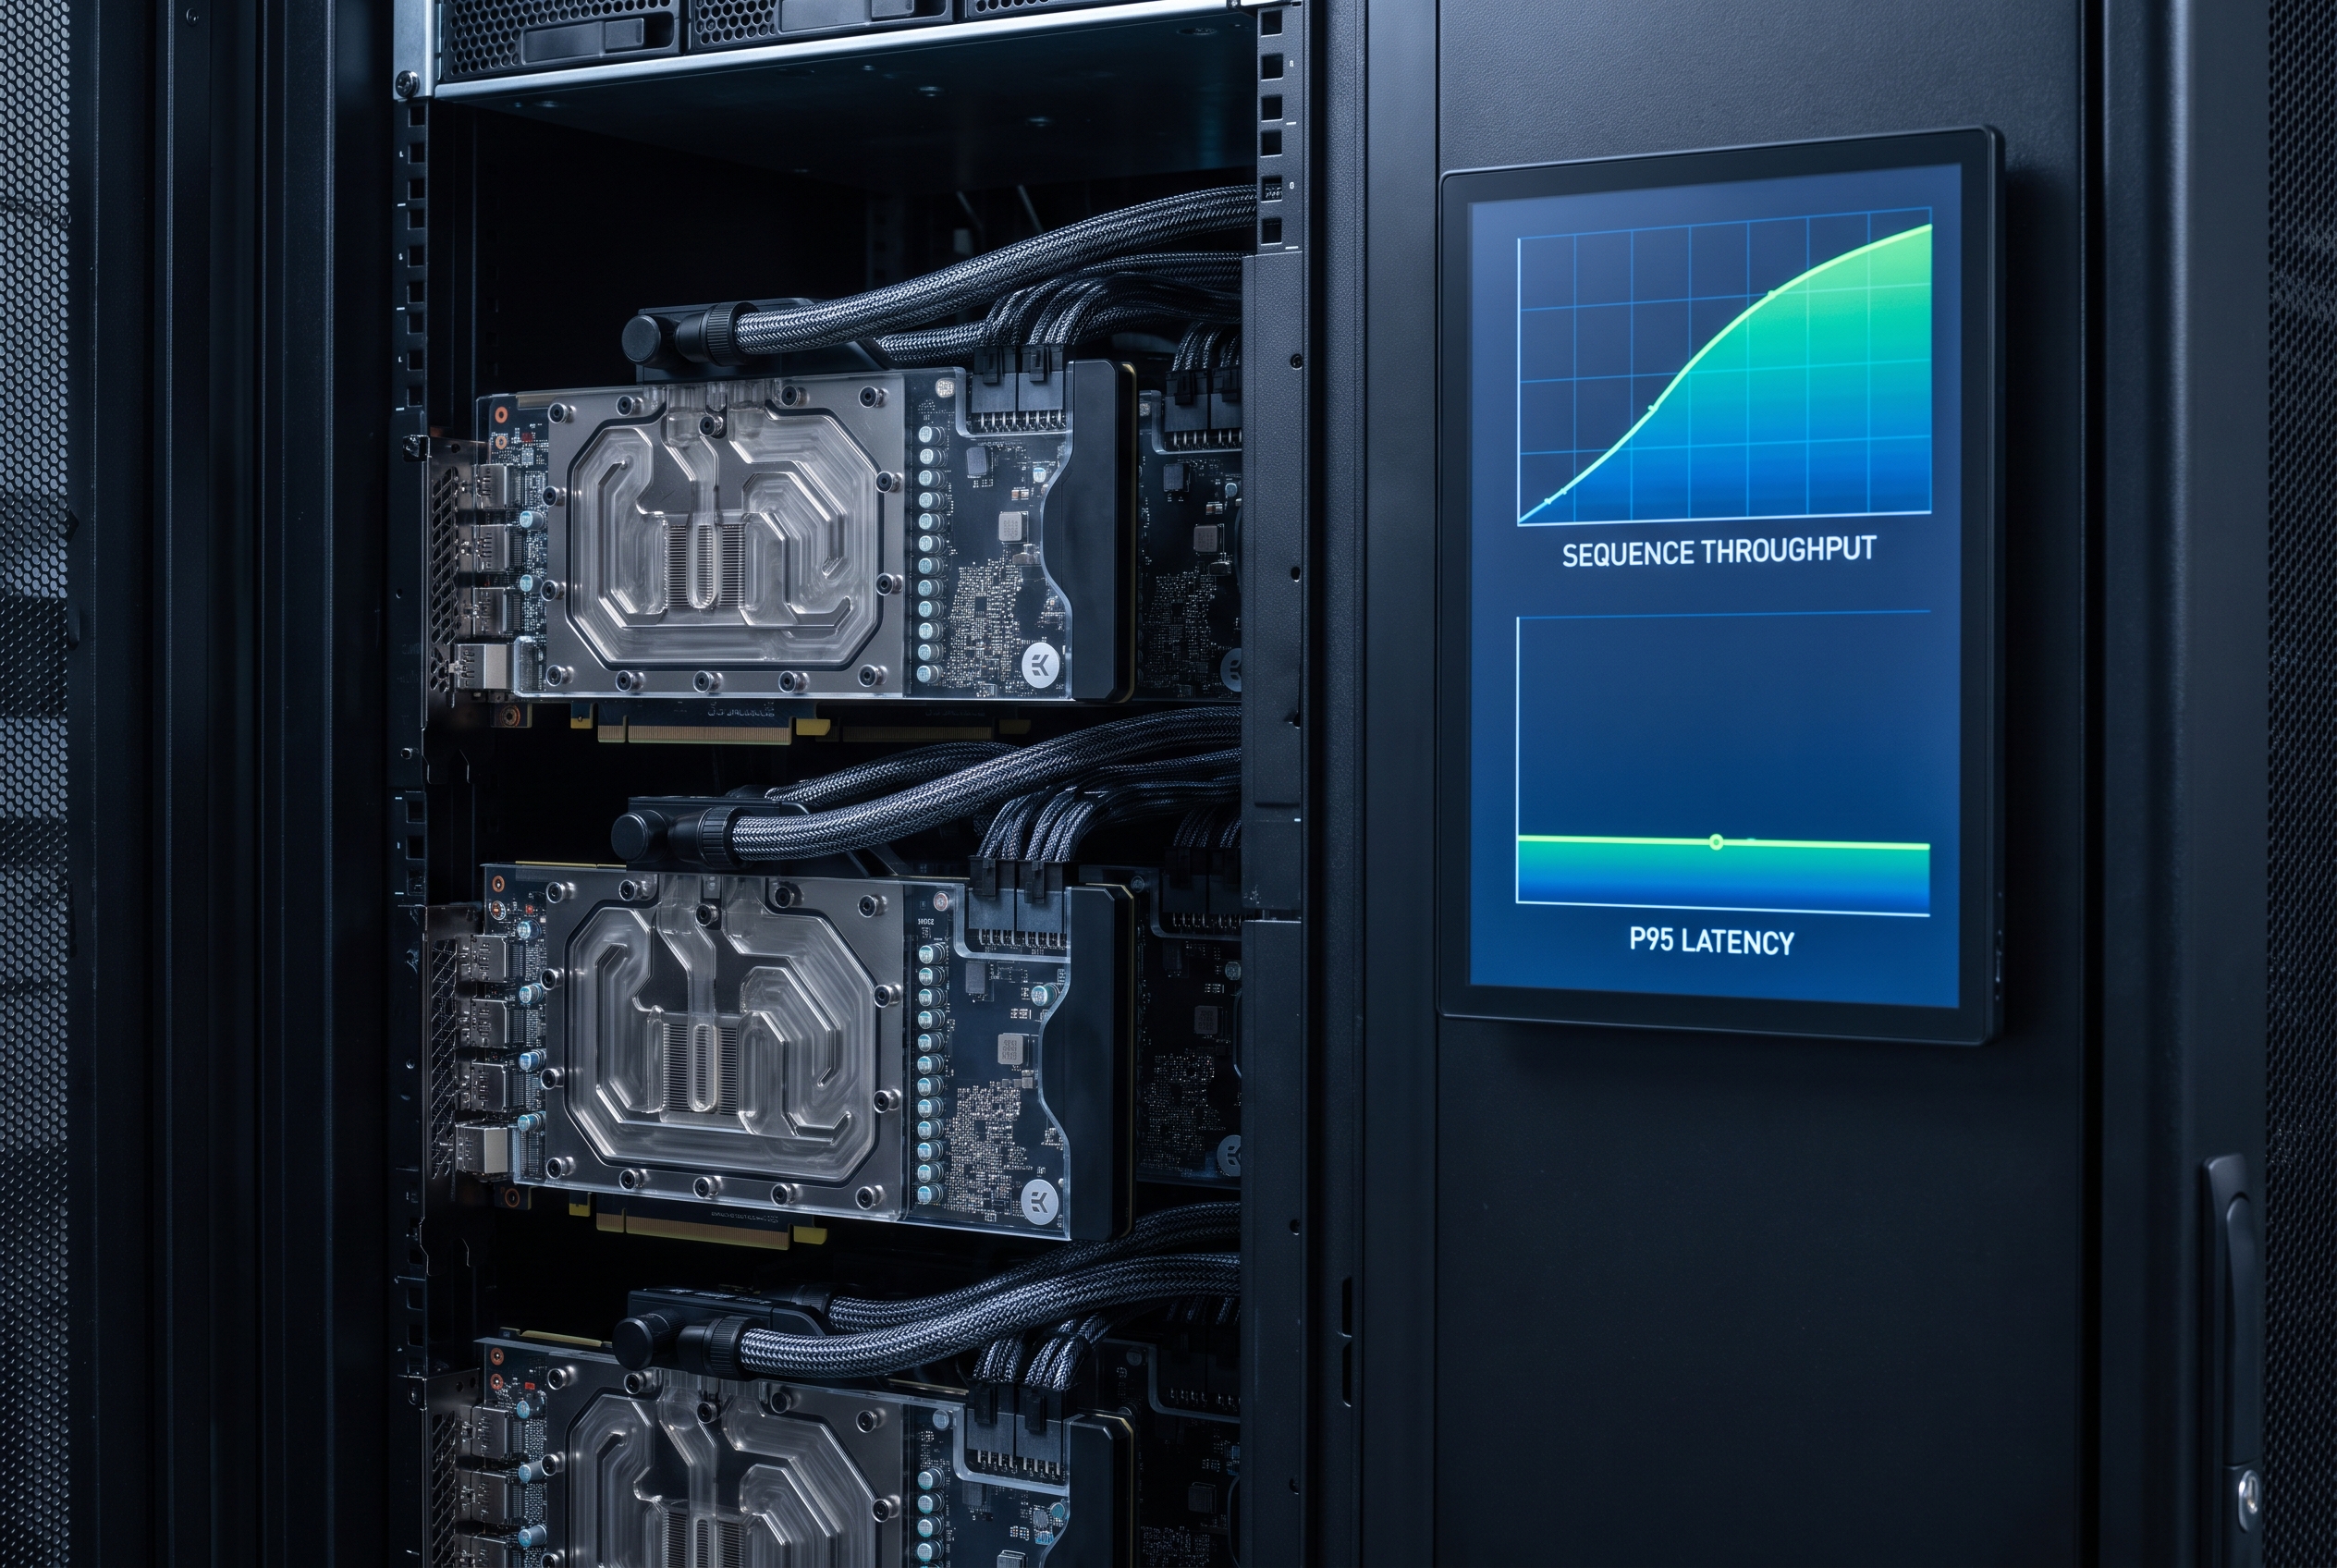
Token type matters too. Long input prompts stress prefill. Long answers stress decode. A system that reports 1,500 total tokens per second can still feel slow if decode throughput is low and each interactive user waits on the next token. Track input tokens per second, output tokens per second, time to first token, and inter-token latency separately. This prevents a batch job metric from being mistaken for an interactive-chat metric.
Workload shape changes the result
Model size sets the first constraint. A quantized 8B model may fit on one GPU with room for many concurrent sequences. A 70B model may need tensor parallelism across several devices, adding communication overhead. An accelerator with more memory can cost more per hour yet reduce the total cluster size or preserve KV-cache capacity. That can lower token cost and improve tail latency at the same time.
Context length changes the economics again. The KV cache grows with active sequences and context. If a 32,000-token workload forces aggressive eviction, batching shrinks and the cluster spends more time on prefill. A short-prompt benchmark will not expose that. Test the 50th, 95th, and 99th percentile prompt lengths from production traces, not just a single 512-token request.
Utilization is the quiet multiplier. A node booked for 24 hours but busy for 10 has 41.7% utilization. Its apparent $3-per-million-token result at full load becomes $7.20 when the idle time is allocated to the delivered workload. Autoscaling, request routing, and a warm-pool policy therefore belong in the cost model. They are not secondary platform details.
Quantization can alter the answer, but only after quality checks. FP8 or lower-precision weights may increase throughput and reduce memory pressure. The right comparison is not simply tokens per second. Compare task accuracy, refusal behavior, structured-output validity, and latency at the same traffic mix. A cheaper token that raises retries is not cheaper.
How to benchmark a fleet
Start with a representative trace. Sample real request lengths, arrival patterns, model choices, tool calls, and streaming requirements. Remove sensitive content, retain the shape, then replay it through each candidate configuration. A 30-minute steady-state run often hides cache churn and scale events; run long enough to observe the load transitions that happen in the application.
- Record total hourly cost for accelerators, hosts, storage, and network services.
- Measure accepted input and output tokens, not generated tokens that were cancelled or retried.
- Report p50 and p95 time to first token, plus p95 inter-token latency.
- Measure utilization, batch size distribution, queue time, and cache hit rate.
- Separate online interactive traffic from asynchronous bulk work.
Then calculate two figures. The first is cost per million accepted tokens. The second is cost per successful task. The token metric exposes serving efficiency. The task metric catches workflows where a model produces more tokens, more retries, or worse structured output. Both should be segmented by route, model, region, and context-length band.
Open-source serving engines make this measurement practical. vLLM documents continuous batching and paged attention as mechanisms to improve memory use and throughput. NVIDIA also publishes inference guidance that treats the system as a whole rather than a single accelerator. Neither source replaces a workload test, but both explain why the GPU SKU alone cannot predict the bill.
What infrastructure teams should buy
Buy capacity against a service-level objective, not a theoretical peak. Define a latency ceiling, quality gate, expected context distribution, and minimum availability target. Price the smallest configuration that passes them under the forecast traffic mix. Test a higher-memory option when cache pressure or sharding dominates. Test a lower-cost option when throughput is already adequate and utilization is low.
Set a weekly FinOps review around cost per million accepted tokens, p95 latency, and utilization. An unexplained rise in token cost usually points to one of four causes: longer prompts, lower batching, more idle capacity, or a model/runtime change. Those are actionable signals. GPU-hour spend alone only says that money left the account.
NVIDIA AI Inference explains its cost-per-token framing for end-to-end inference systems. For a practical view of utilization and right-sizing, see Mirantis guidance on inference costs. Teams can use those principles to turn GPU choices into repeatable capacity decisions.
Run representative evaluations, compare delivered-token economics, and scale production inference on Wiro.